
By Robert Thomas
Readers of this blog will be well-aware of mandatory reconsideration (MR) and the discussion surrounding it. More than half a million MR decisions have been made since the introduction of MR in 2013, making this one of the largest areas of administrative decision-making. The Department for Work and Pensions (DWP) recently published data on mandatory reconsiderations (MRs). This blog presents this data and compares with data from the Ministry of Justice (MoJ) concerning tribunal appeals.
The DWP data is divided between two main benefits: Employment and Support Allowance (ESA) and Personal Independence Payments (PIP).
Figure 1 shows the number of ESA MR decisions and outcomes.
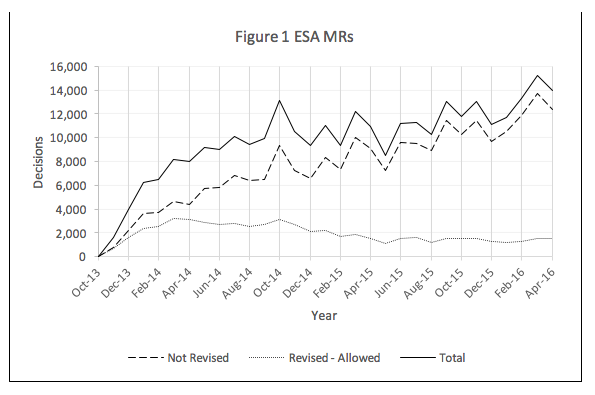
The figure shows the following. First, the total number of ESA MRs has increased steadily following the introduction of MR in October 2013; in the year to April 2016, the number of MRs registered each month has gone from 9,400 in May 2015 to 13,600 in April 2016. Between October 2013 and April 2016, a total of 306,500 ESA MRs had received a decision.
Second, the figure also shows the outcomes of mandatory reconsiderations. “Not revised” means that the initial decision stands. “Revised” means that the initial decision has been overturned. Someone found Fit for Work would be awarded ESA or someone put in the Work Related Activity Group (WRAG) claimant would be put in the Support Group.
After an initial increase in the number of MRs in favour of the claimant, the number has subsequently declined. As the DWP states: “Due to a combination of low numbers of registrations and time needed for new operational practices to settle down, the proportion of MR decisions which were initially revised and allowed was quite high (e.g. 44% in November 2013).” However, now that these practices are established, the average number of decisions which have been revised and allowed (for the most recent year up to April 2016) is 11%. The overall success rate is 20% for all ESA MRs up to April 2016.
How does this compare with appeal outcomes? Figure 2 shows the proportion of ESA appeals allowed and dismissed by the First-tier Tribunal.
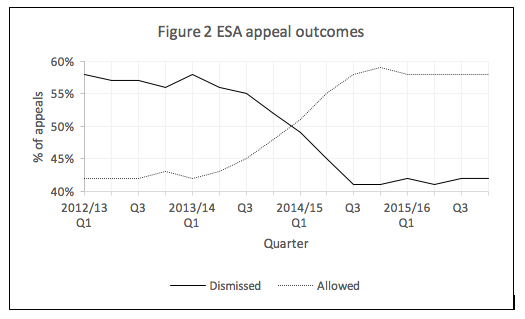
When comparing MRs and appeals, it is important to bear in mind that the DWP and tribunals handle a different volume of cases. In 2014/15 to 2015/16, there were 110,295 ESA appeals. Almost uniquely amongst tribunal statistics, the proportion of allowed ESA appeals has overtaken that of dismissed appeals. This is all the more remarkable because ESA has been a very high-volume jurisdiction.
An obvious question arises: What explains the disparity in outcomes between MRs and appeals? We return to this below.
Figure 3 shows the number of PIP MRs for new claims. The figure shows the total number of MR decisions. “New Decision – Award Changed” means the MR was successful for the claimant. “New Decision – Award Unchanged” means the initial decision stands (i.e. the claimant was unsuccessful).
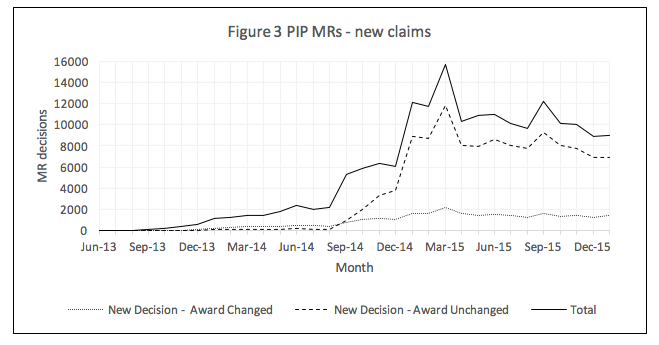
The overall average success rate for PIP MRs for new claims is 15%.
Figure 4 shows the number of PIP MRs for reassessments, that is, the reassessment of those claims previously decided.
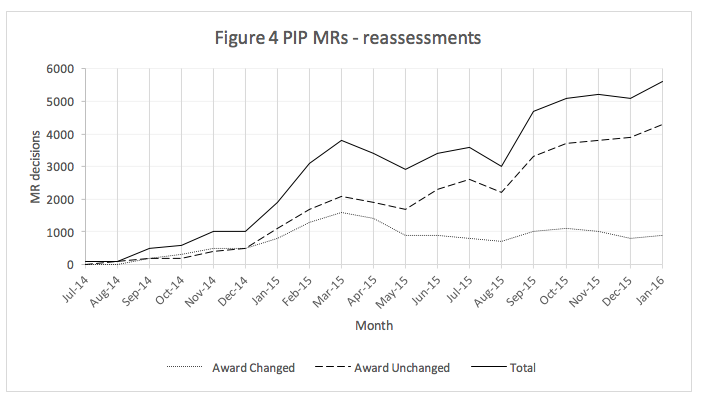
The overall average success rates for PIP MRs for reassessment claims has been 28%.
The MoJ’s tribunal statistics do not distinguish between PIP appeals for new claims and reassessment. However, the statistics do provide detail on the number and outcome of PIP tribunal appeals. In 2015/16, first-tier tribunals decided 49,742 PIP appeals, of which 19,112 appeals (38%) were dismissed and 30,236 appeals (61%) were allowed.
Again, the question arises: What explains the differences between the proportion of successful MRs and allowed appeals?
The data sheds no light here. Differences in decision outcomes of MRs and appeals can be influenced by a range of factors. For instance, the filtering of cases as they proceed throughout the process; the decisions claimants make about deciding to challenge; access to advice; the different procedures between MR and appeals; and the submission of new evidence and information at the appeal stage are just some of the factors that can affect decision outcomes in a number of ways and combinations.
Several hunches and theories can be highlighted. It might be that MR filters out the clearly wrong decisions, while more borderline cases proceed to tribunals, and tribunals take a different view. It might be the case that for some people, the MR decision provides better refusal reasons and adequately resolves the matter without the need to proceed to a tribunal. It might be that tribunals investigate cases more thoroughly than MR does. It might be that cogent oral evidence before the tribunal is often found to be more persuasive by a tribunal when compared with a telephone call through MR. It might be that additional evidence is submitted to the tribunal that was not available to the MR decision-maker. It might be that the quality of MRs does not compare well with that provided by tribunals. Comparing the data highlights the issue, but does not answer it.
What we do know is that MR is cheaper than appeals. The unit cost of mandatory reconsideration is £80, whereas the average cost of an appeal is estimated at £248.[1] We also know that there are inherent trade-offs in operating a decision-making system. Put simply, there is an inherent trade-off between quality and efficiency.
Nonetheless, there is a substantial gap in our understanding of how MR operates in practice. And this is important in terms of the significance of social security decisions for individuals. Further, social security is the largest decision process in the UK.
The above data opens up scope for further investigation. What could be done is a more detailed exploration of other data. For instance, government has different datasets for MRs and appeals. These datasets could be linked up in order to investigate which initial refusal decisions are not upheld at the mandatory reconsideration stage, but then overturned at the appeal stage. It is also important to investigate the reasons for this by examining the decisions of both the MR decision-maker and the tribunal and exploring how reason-giving compares between MRs and tribunals. It is also necessary to know more about the process by which cases proceed from mandatory reconsideration to tribunals: how many refused MRs are not appealed, and why? Is new evidence submitted prior to the appeal being heard? Is something else happening between MR decision and appeal? The data is there. It just needs work on it to investigate the issues further.
More generally, the data highlights the high number of administrative justice decisions now being taken within government itself - as opposed to traditional administrative justice institutions such as tribunals. In total, the DWP has decided 540,700 ESA and PIP MRs since October 2013.
[1] FOI 4367 (27 October 2015); House of Commons Work and Pensions Committee, Employment and Support Allowance and Work Capability Assessments (HC 302 2014-15), [90].
About the author:
Robert Thomas is Professor of Law, School of Law, University of Manchester.

Discussion
Trackbacks/Pingbacks
Pingback: Lee Marsons, Maurice Sunkin and Theodore Konstadinides: The UK Administrative Justice Institute’s submission to the Independent Review of Administrative Law - UK Constitutional Law Association - October 26, 2020
Pingback: UKAJI’s submission to the IRAL - a summary | UKAJI - October 26, 2020